Sales Analysis – Sporting Goods Chain
Date: April 2025
🛠️ Tools Used
Power BI
🎯 Project Scope & Objectives
- Provide a global sales overview with KPIs and regional analysis
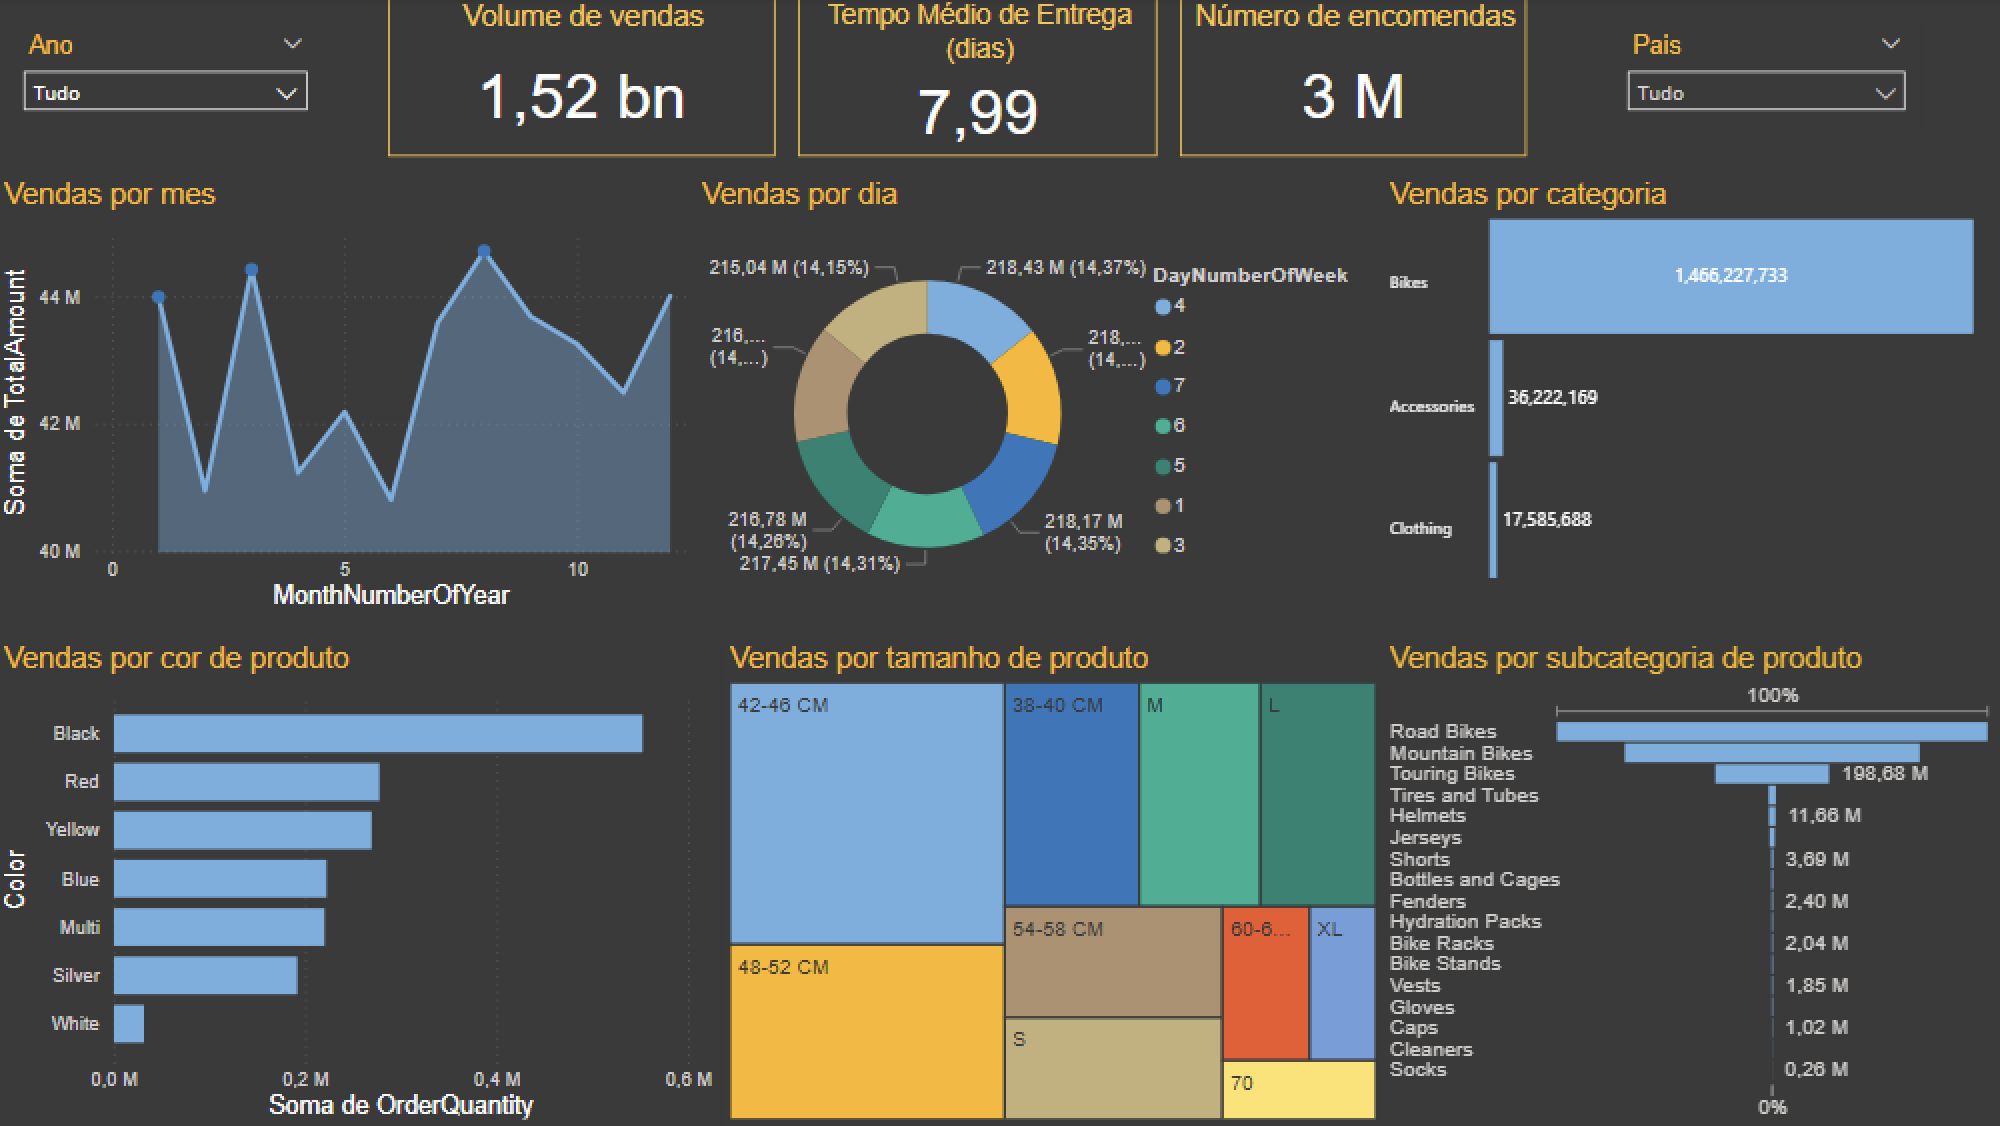
- Explore product seasonality and specificity (e.g., best-selling colors and sizes)
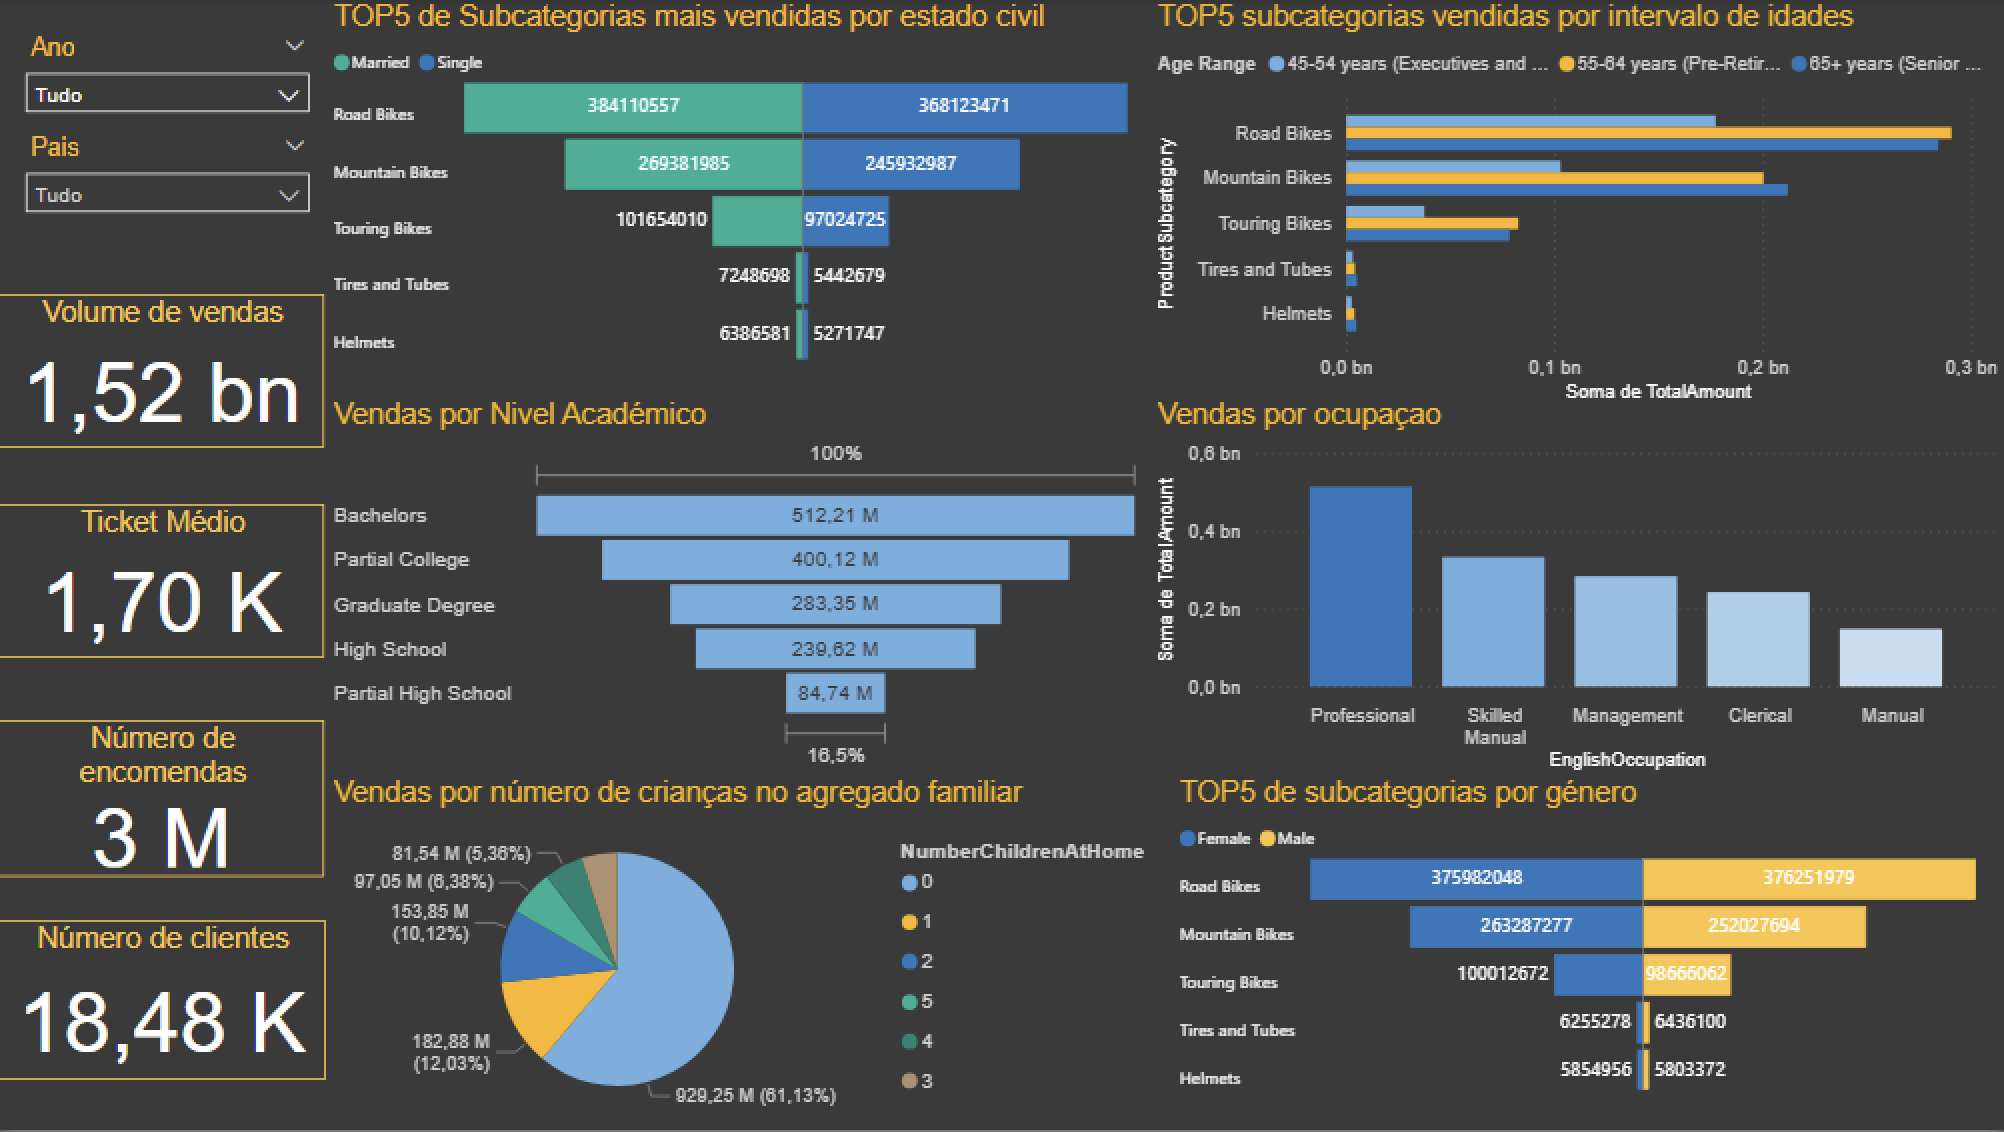
- Segment customer behavior based on demographics and household profile
- Answer predefined business questions using interactive dashboards
🔍 Key Findings
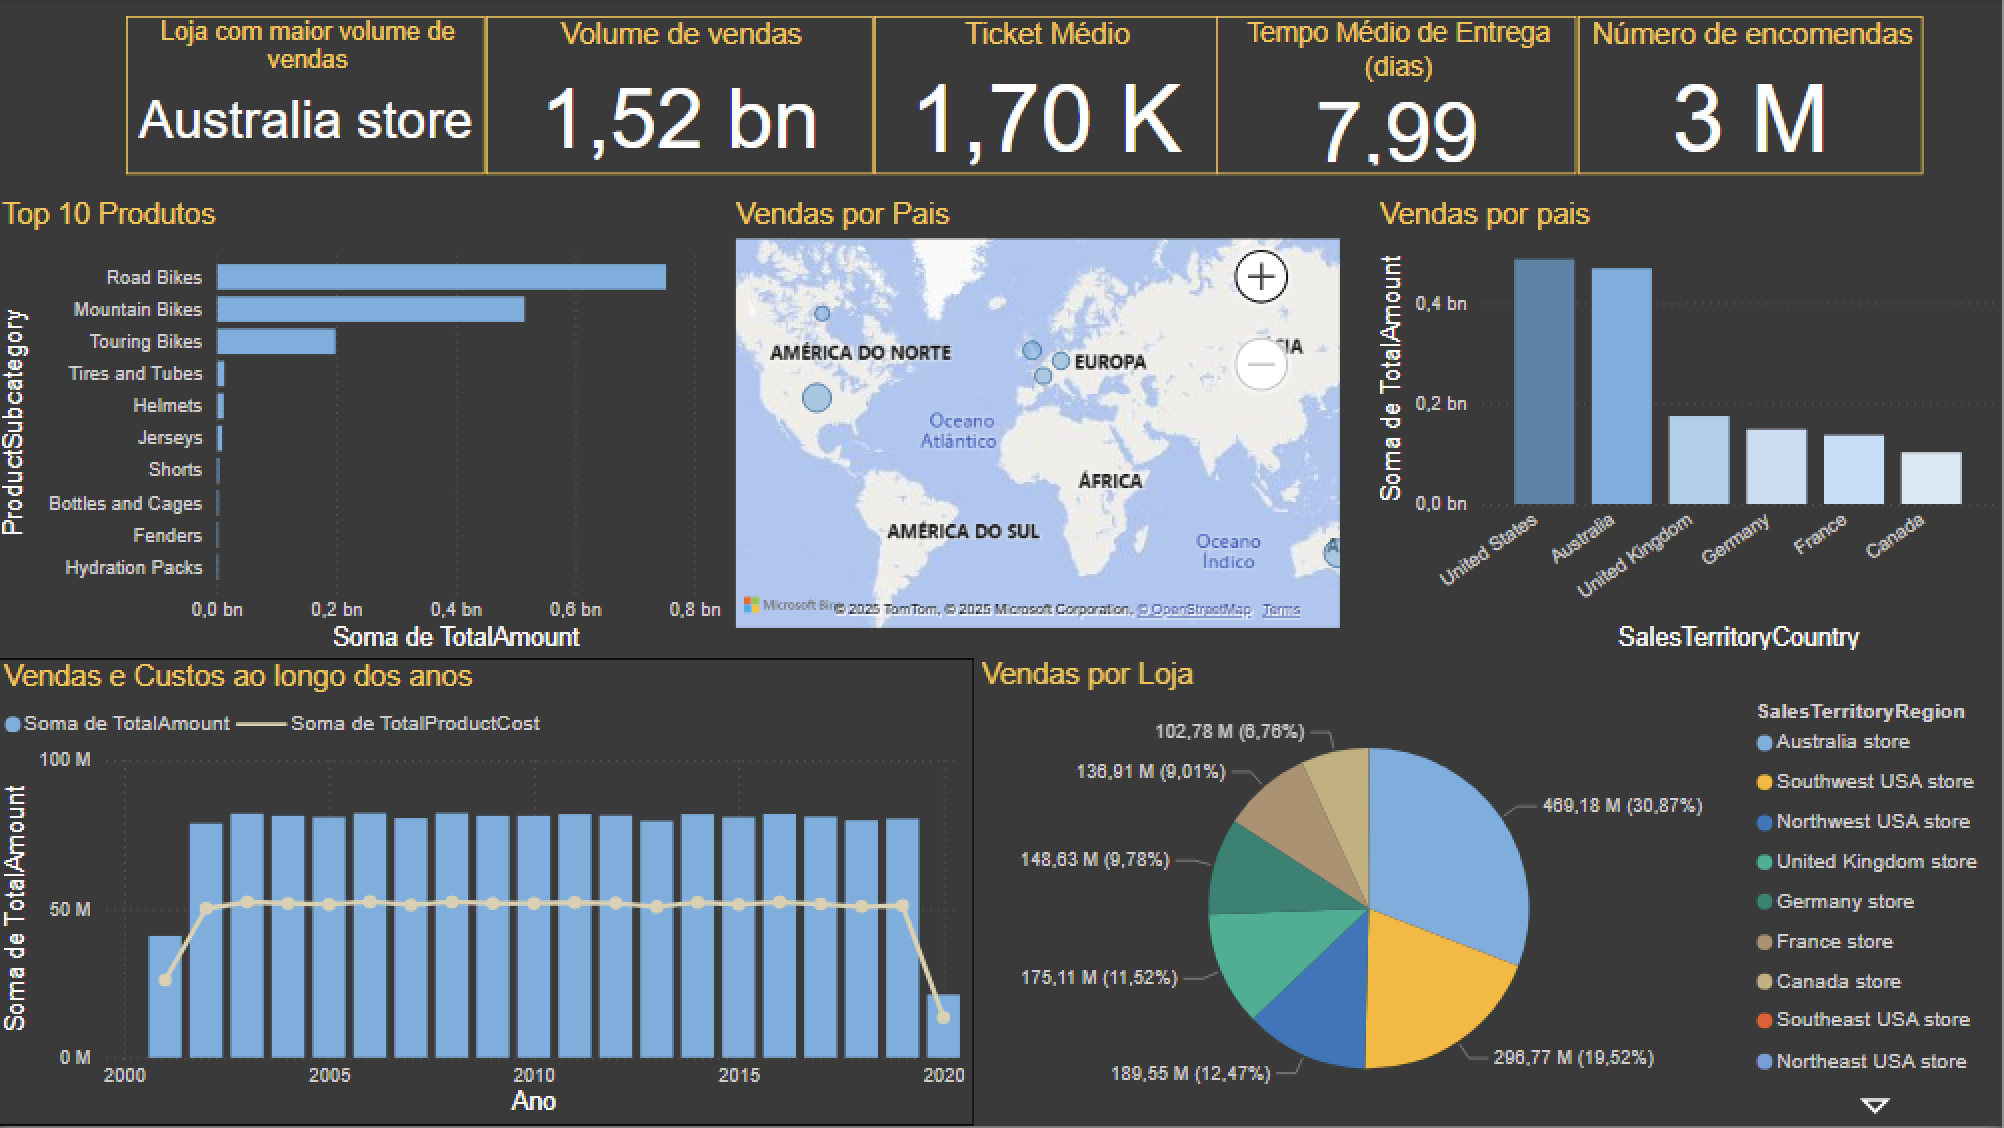
- Top-selling products: Road, Mountain, and Touring Bikes, followed by Tires & Tubes and Helmets
- Mountain bike sales peak in January, March, and August
- The Australia store leads in overall sales volume
- Bikes, Accessories, and Clothing are the top categories sold in every store
- USA has the highest revenue, followed by Australia and the UK
- Customers aged 45–54 and 65+ favor Road and Mountain Bikes
- Customers with no children buy significantly more than others
- Buyers with a Bachelor's degree and professionals generate the most revenue
- Sales peaked between 2005 and 2019, dropping again in 2020
📎 Project Resources
Due to licensing restrictions, public access to the dashboard is not available.
🖼️ Dashboard Screenshots